Tree-based regressor predicts buyer spend from demographics; EDA isolates the segments driving the season.
Source available · Not hosted
PythonPandasSeabornMatplotlibScikit-learn
// Problem
Which customers actually spend the most during the season? Purchase records needed cleaning, exploratory analysis, and a predictor that improves on an average-based estimate.
// How I solved it
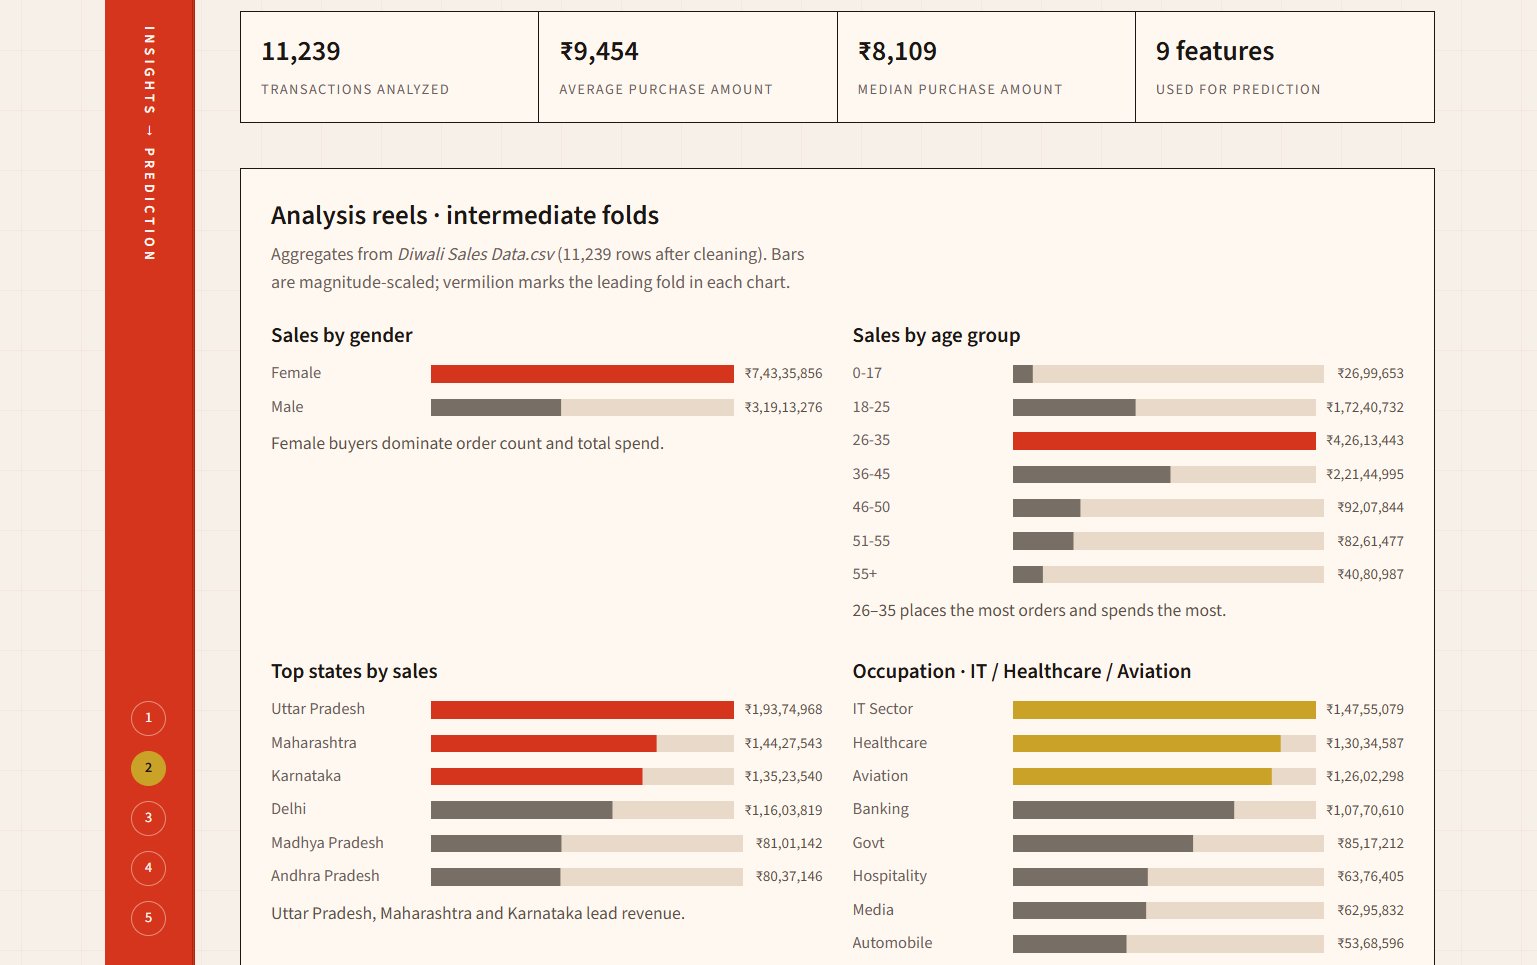
Analysed customer purchase data across demographics — age, gender, occupation, city category, marital status — with Pandas and Seaborn to isolate the segments driving the highest spend.
Built a tree-based regression model (Random Forest in the deployed build) that predicts buyer spend from demographics, using EDA and feature selection to improve on an average-based estimate.
Findings: married women aged 26–35 in Uttar Pradesh, Maharashtra and Karnataka, working in IT, Healthcare and Aviation, were the highest-spending segment across Food, Clothing and Electronics.
// Features
Pandas + Seaborn EDA across age, gender, occupation, city category and marital status.
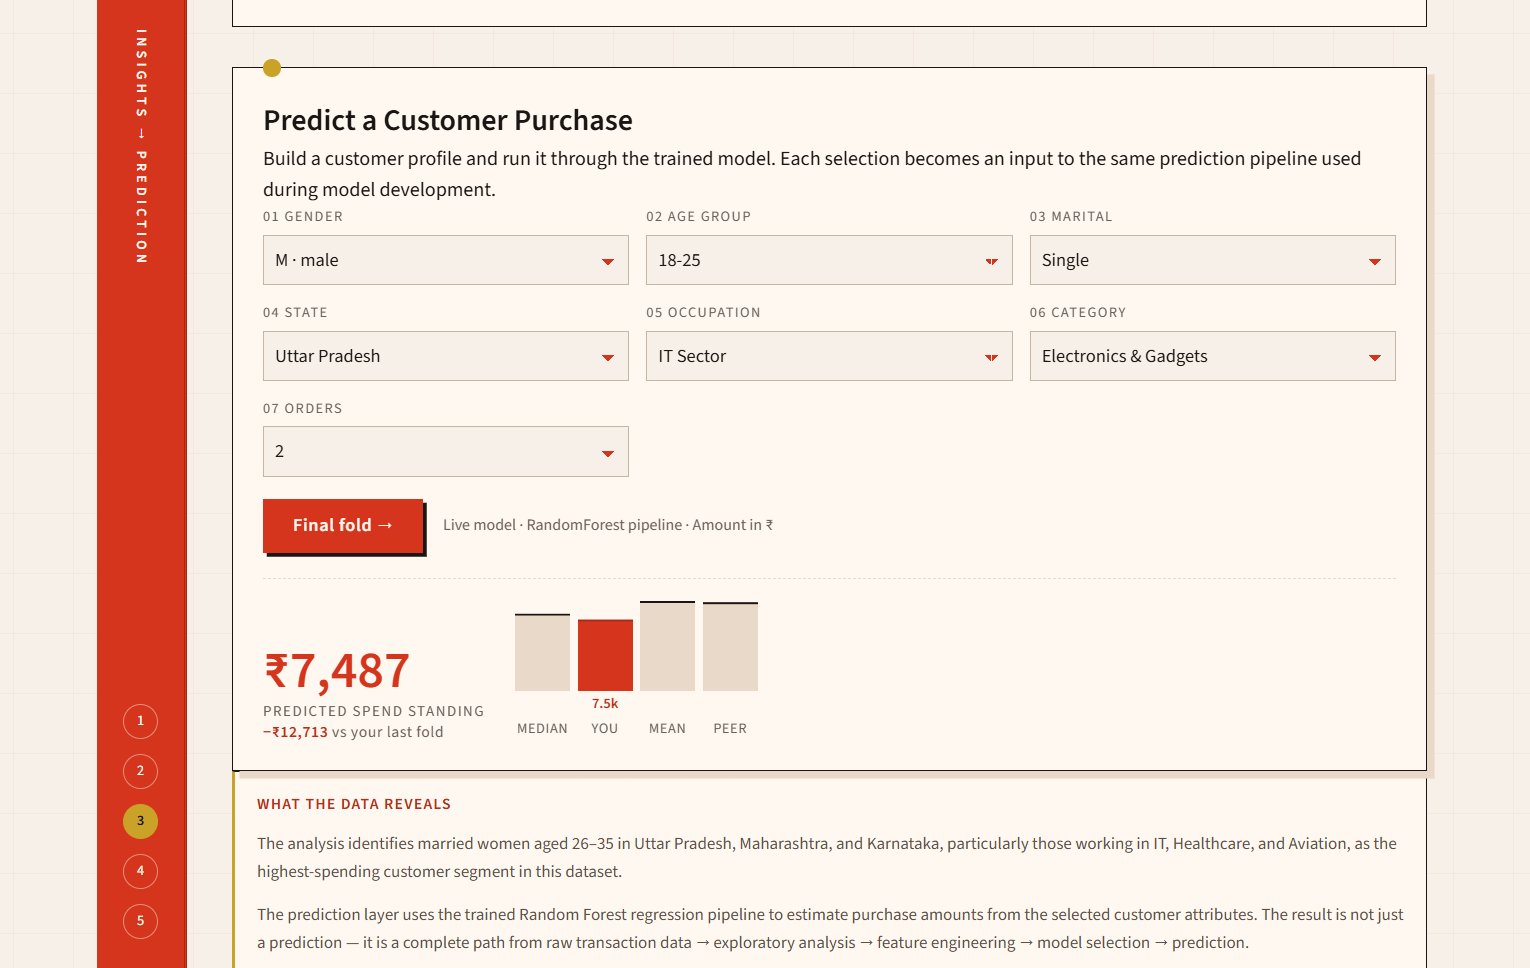
Random Forest regressor predicting buyer spend from demographic features.
Prediction panel comparing spend against median, mean and peer baselines.
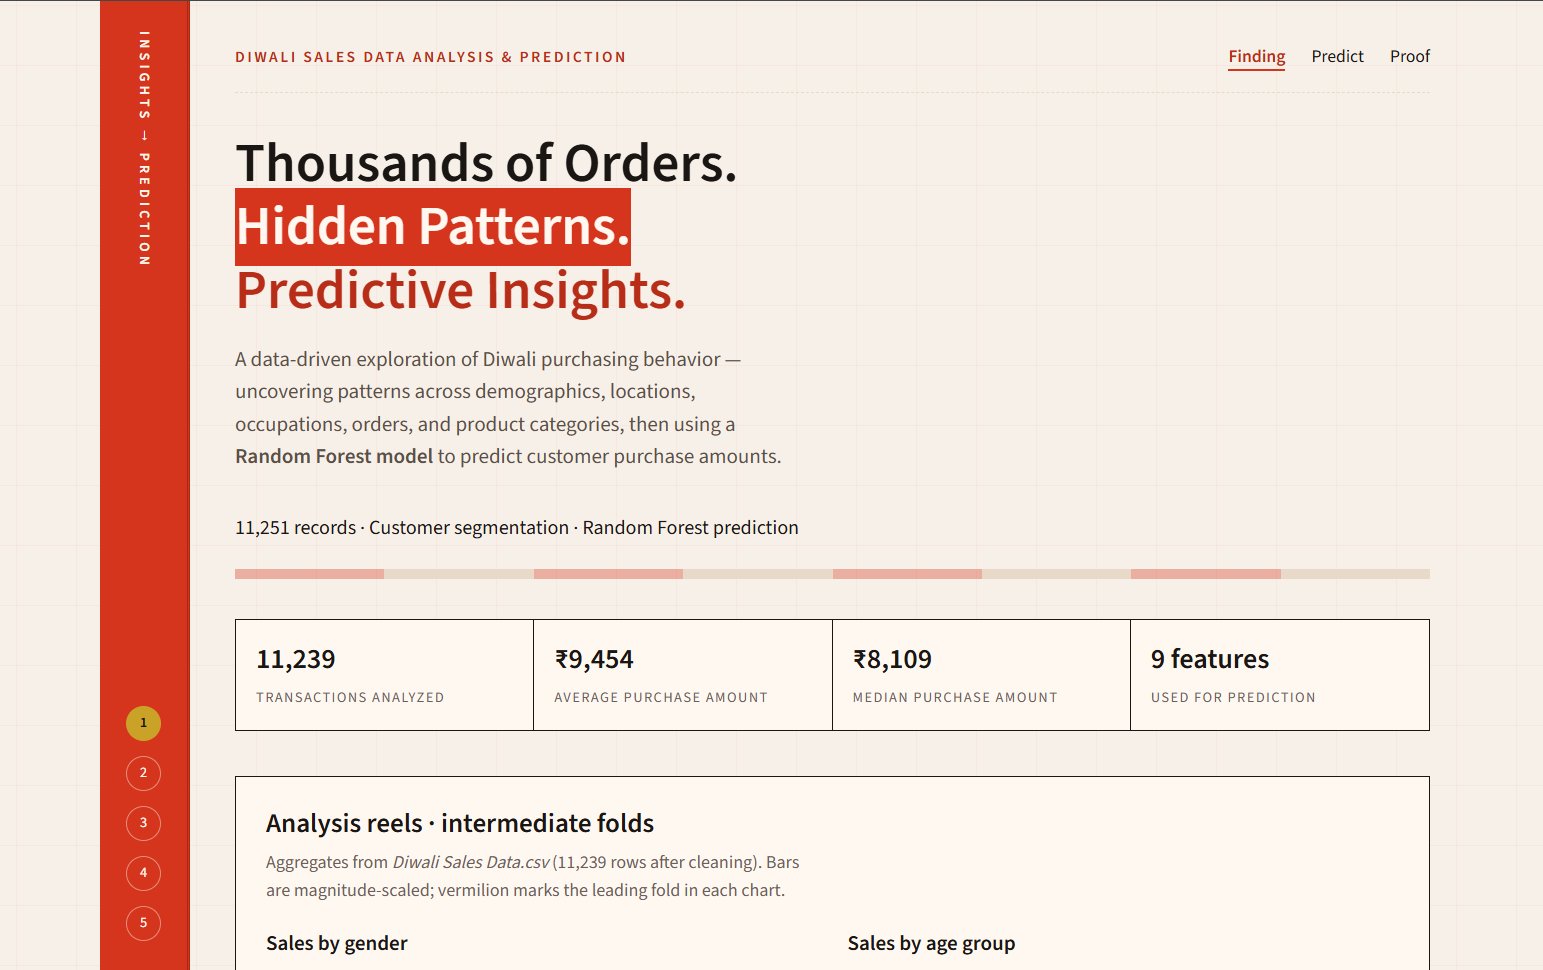
Report views — dataset counts, model summary and headline findings on one screen.
// Result
Married women aged 26–35 in Uttar Pradesh, Maharashtra and Karnataka, working in IT, Healthcare and Aviation, were the highest-spending segment across Food, Clothing and Electronics.
Known limits: single-season dataset; predictions are directional — for segment comparison, not financial forecasting. Not hosted — clone the repository for notebooks and source.
// Media
01 · Report cover — dataset counts, model summary and headline findings on one screen.
02 · EDA reels — gender, age, state and occupation aggregates.03 · Prediction panel — seven demographic inputs, spend compared to baselines.
Screen recording · analysis flow19.7 MB · loads on demand